
The short version
What conversion rate optimization actually means
Conversion rate optimization, usually shortened to CRO, is the practice of increasing the percentage of website visitors who complete a desired action: a purchase, an enquiry, a booking or a call.
The important part is the word controlled. Redesigning a page because it feels better is not CRO, it is decorating. CRO is only CRO when there is a measurement before, a measurement after, and enough data in between for the difference to mean something.
At ScalEasy it covers four things:
- Working out where visitors drop off, using analytics and session recordings
- Forming a testable theory about why
- Running controlled experiments to prove or disprove it
- Implementing what wins
The expensive habit
When sales are flat, everyone buys more traffic
It is the default reaction, and it is usually the wrong one. Sales are down, so the ad budget goes up. More traffic arrives, at a slightly higher cost per click than last quarter, and lands on the same page that was already failing to convert the traffic you had. The problem gets more expensive rather than solved.
Meanwhile the actual leak sits untouched:
- The checkout asks for a phone number twice
- The pricing page loads in six seconds on mobile
- The enquiry form has eleven fields and nobody has filled it in since March
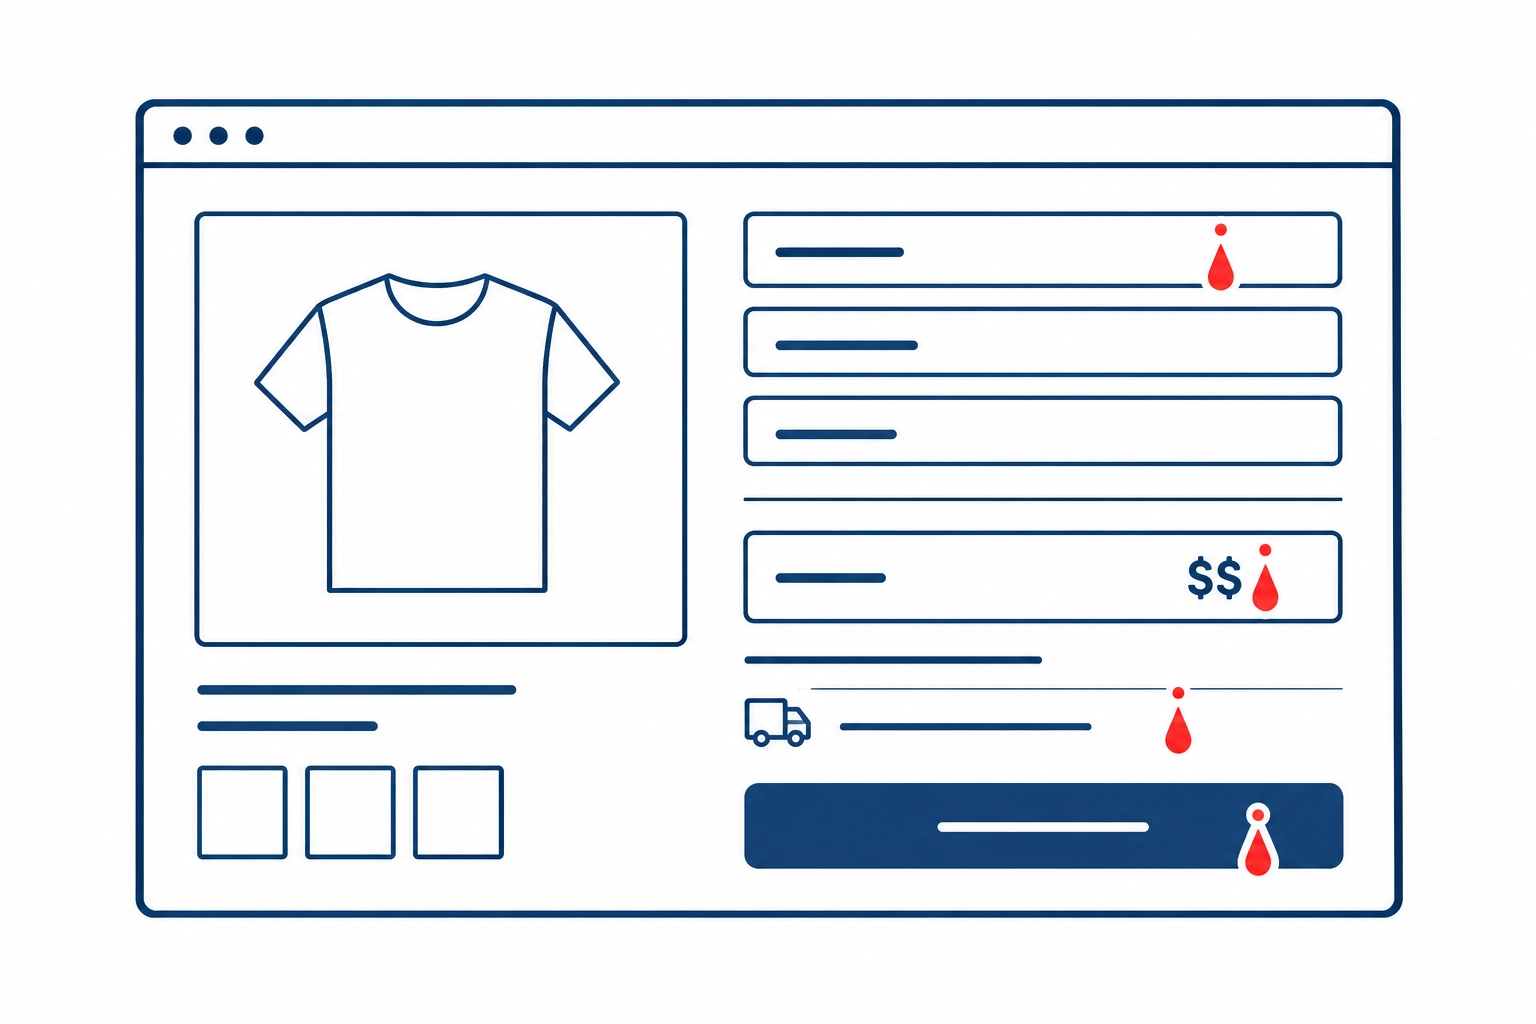
- The product page does not say whether delivery is free, so people open a new tab to check a competitor and never come back
None of this shows up in an ads report. Your agency reports a good month, your platform reports a good month, and your bank account does not agree with either of them.
The argument
Two ways to double your revenue, and what each one costs
Take a store with 20,000 visitors a month, a 1% conversion rate and an average order value of ₹2,000. That is ₹4,00,000 a month. Here are the two routes to ₹8,00,000.
| Buy more traffic | Improve conversion | |
|---|---|---|
| What changes | Visitors go from 20,000 to 40,000 | Conversion goes from 1% to 2% |
| Monthly revenue | ₹8,00,000 | ₹8,00,000 |
| What it costs | Roughly double your current ad spend, every month, forever | A one-off programme of testing and fixes |
| Cost next year | Rises as competition raises CPCs | Falls to zero once the work is done |
| Effect on ads | None. Same conversion rate, more spend | Every existing campaign gets more profitable too |
| Time to result | Immediate | 2 to 4 months |
The second column is not always the right answer. If you have almost no traffic, there is nothing to optimise and you should buy traffic first. But once you are spending meaningfully on ads, every conversion rate improvement makes that spend permanently more efficient, which is why CRO usually pays back faster than the campaign it improves.
What’s included
Find the leak, prove the fix, ship it
Analytics and funnel analysis
Where people arrive, where they drop, and what the ones who buy did differently from the ones who left. Most sites have never had this looked at properly.
Behaviour analysis
Session recordings, heatmaps and scroll depth. Watching real people struggle with your checkout is worth more than any amount of opinion in a meeting room.
User research and surveys
On-site polls and exit surveys asking the people who did not buy why they did not. Obvious, and almost nobody does it.
Hypothesis and prioritisation
Every change is written as a testable statement with an expected outcome, then ranked by likely impact against effort.
A/B and multivariate testing
Controlled experiments with enough traffic behind them to be statistically valid, run long enough to survive a weekend.
Implementation
We build the winning version properly into the site rather than leaving it running through a testing tool forever.
Technical conversion fixes
Page speed, mobile layout, form validation, payment failures. Often the biggest win and rarely glamorous enough to make an agency proposal.
Our approach
Conversion rate is one third of the job
Optimising for conversion rate alone is how you end up with a site that converts well this quarter and a brand nobody trusts by next year. We work across three pillars, not one.
Conversion rate and order value
The measurable layer. Conversion rate, average order value, revenue per visitor and cart abandonment. This is what gets reported, and it is the outcome rather than the method.
The customer experience
Understanding the whole journey, not just the checkout. Fixing experience raises conversion as a side effect, and it lasts.
The brand
Consistency between what your ads promise and what your site delivers. A visitor who arrives from an ad and finds a different message has already started doubting you, and that doubt shows up as a bounce rate nobody can explain.
What good looks like
What counts as a good conversion rate
The honest answer is that it depends on your industry, your traffic source and your price point. Here is the range worth measuring yourself against.
| Typical range | Good | What usually limits it | |
|---|---|---|---|
| E-commerce, general | 1% to 2% | 3%+ | Checkout friction and trust signals |
| E-commerce, high value | 0.5% to 1% | 2%+ | Longer consideration, needs nurture |
| Lead generation, B2B | 2% to 5% | 8%+ | Form length and unclear next step |
| Local services | 3% to 8% | 10%+ | Phone visibility and trust |
| Hospitality, direct booking | 1% to 3% | 5%+ | Price comparison against OTAs |
| Landing page, paid traffic | 3% to 8% | 12%+ | Message match between ad and page |
Two things matter more than the benchmark. Whether your rate is improving over time, which is entirely within your control. And whether you are measuring the right conversion at all.
In practice
Eight places the money usually leaks
The checkout or enquiry flow
Number of steps, number of fields, guest checkout, payment options, and what happens when a payment fails.
Product and service pages
What information is missing at the moment of decision. Delivery cost, return policy, sizing, availability.
Mobile experience
Most Indian traffic is mobile and most sites are designed on a desktop. Tap targets, form keyboards, sticky calls to action.
Page speed
Every additional second before the page becomes usable costs conversions, especially on mobile networks outside the metros.
Calls to action
Wording, placement, prominence. Three equally weighted buttons is the same as no button.
Trust signals
Reviews, guarantees, a visible address and phone number, secure payment marks.
Forms
Field count, validation behaviour, error messages, and whether the form is asking for information you do not actually need yet.
Message match
Whether the page delivers what the ad or search result promised. Fixing this often lifts campaign performance more than anything done inside the ad account.
How we measure
The stack, and why it matters that we own it
We work with GA4 for funnel and event data, Microsoft Clarity and Hotjar for session recordings and heatmaps, VWO or Convert for split testing, and Google Tag Manager for the event tracking underneath all of it.
Every tool account we set up is created in your name, so if you leave, the historical data and the test results stay with you.
Who we do this for
Where the leaks tend to be
Checkout abandonment, mobile friction, and the return-to-origin problem. A lift in conversion rate means nothing if the extra orders are prepaid-averse and come straight back, so we optimise toward delivered revenue rather than orders placed.
The direct booking page competing against an OTA listing of the same room. Usually a price transparency and trust problem rather than a design problem.
Appointment flows and call conversion. Most of these visitors want to phone rather than fill a form, and the number is often the least visible thing on the page.
Enquiry forms asking for a budget and a timeline from someone still researching. Shorter forms and a clearer next step usually outperform any layout change.
Click-to-call prominence, service area clarity and reviews. Small changes here move the number quickly because intent is already high.
Why work with us
We can implement what we recommend
We build the site as well
The usual CRO failure is a report full of recommendations that sit in a queue for four months because your developer is busy. We build websites, so the fix ships in the same engagement that found it.
We run the ads too
That means we can see both halves. When the campaign is fine and the page is the problem, or the page is fine and the traffic is wrong, we can tell the difference instead of guessing.
We will tell you when not to test
If your traffic is too low for a valid experiment, we will say so and fix the obvious problems directly instead of running a test that cannot produce an answer. Charging for statistically meaningless tests is common in this industry and we are not going to do it.
Sixteen years, 350+ projects
Enough pattern recognition to know where to look first, which shortens the expensive part of the process.
Where we are
Built in Haldwani, working across India
We are based in Haldwani, Uttarakhand. For most of the last sixteen years the work ran out of Delhi NCR, and in 2024 we moved operations here and kept every client through the move.
We work with brands in Delhi, Mumbai, Bangalore and Dehradun, and with clients in the UK and Canada. What changed is that businesses in Haldwani, Nainital, Rudrapur and Kathgodam can now get this kind of work done without hiring an agency six hours away.
One thing worth saying about optimising for Indian traffic specifically. A large share of it arrives on mid-range Android phones over patchy mobile data, often outside the metros. Sites designed and tested on a fast desktop connection in an office consistently underperform for those users, and that gap is invisible unless someone deliberately looks for it. We test on the conditions your customers are actually using.

How we work
Four stages, and the audit is yours either way
Audit
Analytics review, funnel analysis, session recordings, heuristic walkthrough of the key flows, and a check that your tracking is even recording the right things. Roughly half the time we find a measurement problem before we find a conversion problem.
Hypotheses and priorities
Every finding written as a testable statement with an expected impact, then ranked by likely return against effort. You see the list and choose what we start with.
Test and implement
Build the variant, run it long enough to be valid, read the result honestly including the tests that fail, and ship the winners into the site properly.
Compound
A continuous cycle rather than a project. Each result informs the next hypothesis, and the site gets measurably better every quarter.
| Stage | Timing |
|---|---|
| Audit | Weeks 1 to 2 |
| Hypotheses and priorities | Week 3 |
| Test and implement | Weeks 4 to 12 |
| Compound | From week 8, ongoing. Continuous cycle. |
Testimonials
Proof,
Not Promises.

ScalEasy showed up exactly when we needed them. We'd come out of some rough months with our last agency, poor communication, zero business understanding, just noise. ScalEasy is the opposite. They get how we think, they get the market, and somehow they've made working together genuinely fun.
ScalEasy showed up exactly when we needed them. We'd come out of some rough months with our last agency, poor communication, zero business understanding, just noise. ScalEasy is the opposite. They get how we think, they get the market, and somehow they've made working together genuinely fun.
Fit
Worth checking before you enquire
Probably a good fit if
- You have traffic and it is not turning into revenue at the rate it should
- You are spending steadily on ads and want that spend to work harder without increasing it
- You get at least 200 conversions a month, which is roughly the floor for valid A/B testing
- You are willing to let data overrule internal opinion, including yours and ours
- You can give it three to four months, because the first month is diagnosis
Probably not
- You have very little traffic. There is nothing to optimise yet. Start with ads or SEO and come back.
- You want a redesign. That is a website project, and we do those separately.
- You want a guaranteed percentage lift. Some tests fail, and any agency guaranteeing a number is quietly planning to cherry-pick which ones they report.
- You are unwilling to change the site based on what the data shows.
Deliverables
What lands in your hands
- A full conversion audit with prioritised findings in the first month, yours to keep
- Correctly configured GA4 and event tracking, verified against real conversions
- Session recording and heatmap setup in accounts owned by you
- A running hypothesis backlog, ranked by expected impact
- Test results reported honestly, including the ones that did not work
- Winning variants built properly into the site, not left running in a testing tool
- A monthly report on conversion rate, revenue per visitor and what changed
- One named point of contact who knows the account
Investment
What CRO costs with us
with prioritised roadmapfrom ₹25,000
with continuous testingfrom ₹60,000 / month
ads or SEO retainerReduced rate, quoted together
for a testing programmeFour months
If you are not sure CRO is worth it yet, start with the audit. It is a fixed price, you keep the findings, and you can implement them yourself or with us.
FAQ